

Story points as a measure of effort
In agile methodologies, the story point is used as a way to estimate the effort it would take to complete a piece of work. The inputs to estimate story points are the complexity of the task and the amount of times that the task must be executed.
During agile rituals (sometimes called meetings), the number of story points for a task is estimated by all the members of an agile team. The value of this estimation process is two fold.

First, it creates a space for a dialog about a task. Estimation is done first by each team member individually. Then the estimated story points are simultaneously revealed to the group along with the source of each estimate. If two members in a team assigned a very different number of story points, it is important to find out why. A discussion should follow. This is very valuable because it could be that the person that estimated a lower number of story points missed some aspects of the task, e.g. underestimated the complexity of the task, or they know a shortcut, a way to reduce the perceived complexity of the task, e.g. they know of a technology that would allow them to complete the task with less effort.
Second, it forces us to constantly analyze and practice predicting the future. Practice can lead to learning and learning can lead to mastery. By making a decision (assigning 3 story points to a task) and making a decision public you draw a line in the sand, you take a stand. This allows you to later compare your prediction to the actual outcome and learn.
If the inputs to estimate the number of story points for a task are complexity and task repetition, how do we determine each? Counting the amount of times a task must be executed does not seem daunting. But how do we measure complexity? The articles focuses on complexity and how to approach it.
A pragmatic definition of complexity
Let’s develop intuition about complexity by sorting systems from low to high complexity.
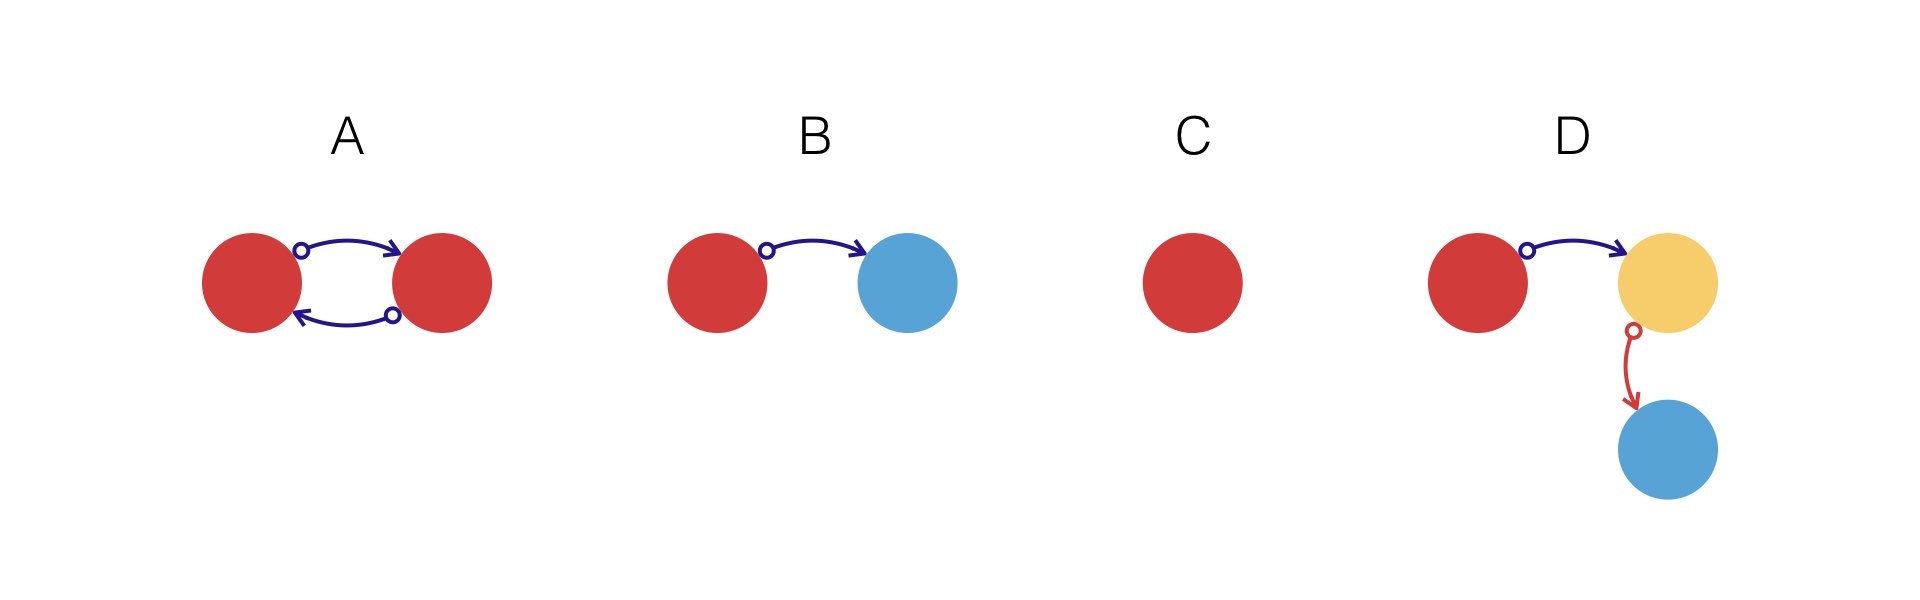
Take a look at the diagram below which shows models for four hypothetical systems. Try to sort these models from less to more complex. The circle represents an element, a part. Because all circles are red, you can assume that these elements are of the same type in a given diagram. The lines indicate connections between elements and the color the type of the connection, i.e. all connections are of the same type. Which diagram is the simplest, which is the most complex? Give it a try.

If you concluded that C is the most simple system and D the most complex, fantastic. B is more complex than C because it hast two circles and one connection. A is more complex than B because it has one additional connection. D it the more complex than A because it has one additional circle.
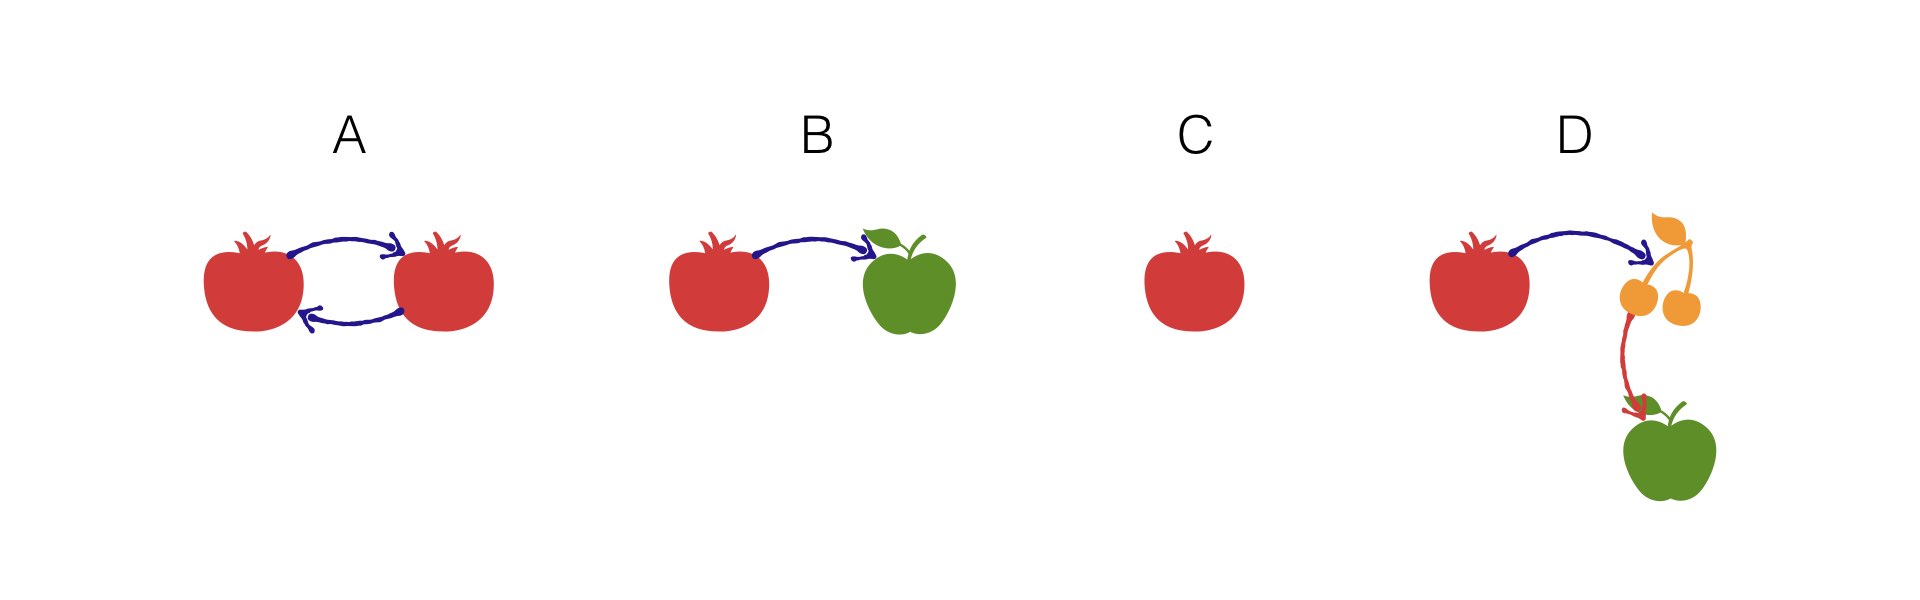
Now let’s repeat the previous exercise with the diagram below. The same rules apply, circles are parts. Lines represent connections between parts. Different colors indicate that the parts and or lines represent different types of parts or connections within the same diagram.
Once again, C is the most simple system. Both A and B are more complex than C and less complex than D. But is A more complex than B or B more complex than A?
Translating complexity into effort
Let’s keep this practical. The point of this article is to get a feel for how to go about evaluating the complexity of a task to estimate the effort required to complete it.
Instead of circles, let’s imagine we are making appetizers with tomatoes, apples and cherries. The arrows are toothpicks that we use to poke the fruit (yes, tomatoes are fruits) and bind it to other pieces of fruit.
This is the same diagram as before, but now you have tomatoes, apples, cherries and toothpicks (the arrows). Your team has the task of making one hundred of each appetizer. Before your start, you want to estimate the effort it will take to complete each task so that you can distribute the work within your team. Task A means making one hundred appetizers that have two tomatoes joined by two blue toothpicks. Task B involves making one hundred appetizers with one tomato and one apple joined by one blue toothpick. To accomplish task C you just have to buy one hundred cherry tomatoes and you have completed the task. Finally, to complete task D you have to join one tomato to a cherry with a blue toothpick and then, in a perpendicular angle, join the cherry to an apple with a red toothpick.
Is task A more complex than task B? To accomplish task A you have to buy two hundred tomatoes, two hundred toothpicks and then build one hundred appetizers. Each will have two toothpicks connecting the two tomatoes. To accomplish task B you have to buy one hundred apples, one hundred tomatoes, one hundred toothpicks and then build one hundred appetizers.
It might take a little less effort to buy two hundred tomatoes (task A) than buying one hundred tomatoes and one hundred apples (task B). Presumably you have to walk to two different places in the supermarket. It might take a little more effort to poke a tomato with two toothpicks instead of one, since you have to exert more force when poking the tomato.
It’s a crapshoot. If I had to estimate the effort for each of these tasks, I would give task A and B the same amount of story points. Task C should have less story points than B and A. Task D should have more story points than B and A. So a “valid” story point allocation would be 1 story point for task C, 2 story points for task A, 2 story points for task B, and 3 story points for task D.
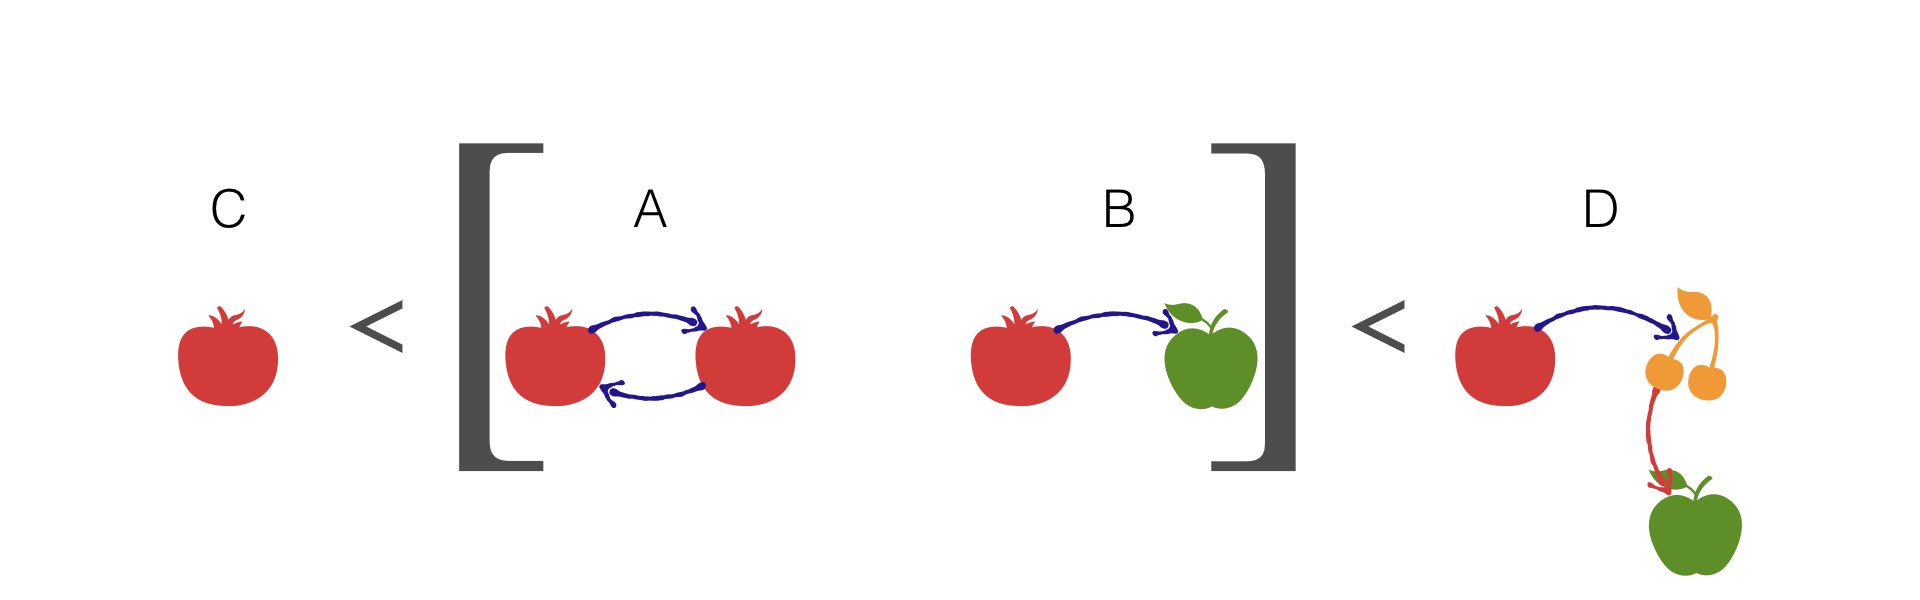
Complexity is relative, and it helps to think about a definition for the basic unit of complexity that will be used to measure in other situations. It is the equivalent of defining what a “liter” is (a unit of volume), or what a “meter” (a unit of distance) is. In the hypothetical examples we’ve discussed, C, the single circle or tomato, becomes the basic complexity unit that can be used to measure the other scenarios.
Complexity in the real world
Tasks are not as homogeneous in the real world. For example, is it more complex to design an appetizer or to build it? Which of the two tasks requires more effort? The answer, of course, is “it depends”.
The goal is to develop your feel for the effort a task requires. As you encounter tasks of different types, initially you will have no idea about the effort relationship between task types. But as you gain experience, as your track your estimations about complexity and effort for each task type, you will eventually find a basic unit of measurement for each of these task categories and develop a mental model for how each translates into the other.
Where we humans often fail is in being systematic. We often fail in tracking and monitoring our expectations and outcomes and in reflecting on the source and causes of significant discrepancy between the two. This is a feedback loop that is essential to make your estimations more accurate.